Reading Elevations

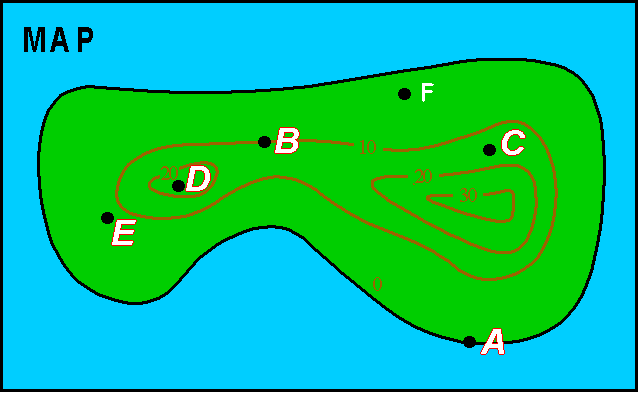
Point A = 0 ft
Point A sits right on the 0 ft contour line. Since all points on this line have an elevation of 0 ft, the elevation of point A is zero.
Point B = 10 ft.
Point B sits right on the 10 ft contour line. Since all points on this line have an elevation of 10 ft, the elevation of point B is 10 ft.
Point C ~ 15 ft.
Point C does not sit directly on a contour line so we can not determine the elevation precisely. We do know that point C is between the 10ft and 20 ft contour lines so its elevation must be greater than 10 ft and less than 20 ft. Because point C is midway between these contour lines we can estimate the elevation is about 15 feet (Note this assumes that the slope is constant between the two contour lines; this may not be the case) .
Point D ~ 25 ft.
We are even less sure of the elevation of point D than point C. Point D is inside the 20 ft. contour line indicating its elevation is above 20 ft. Its elevation has to be less than 30 ft. because there is no 30 ft. contour line shown. But how much less? There is no way to tell. The elevation could be 21 ft, or it could be 29 ft. There is no way to tell from the map.
Point E ~ 8 ft.
Just as with point C above, we need to estimate the elevation of point E somewhere between the 0 ft and 10 ft contour lines it lies in between. Because this point is closer to the 10 ft line than the 0 ft. line we estimate an elevation closer to 10. In this case 8 ft. seems reasonable. Again this estimation makes the assumption of a constant slope between these two contour lines.

Elevation is in feet
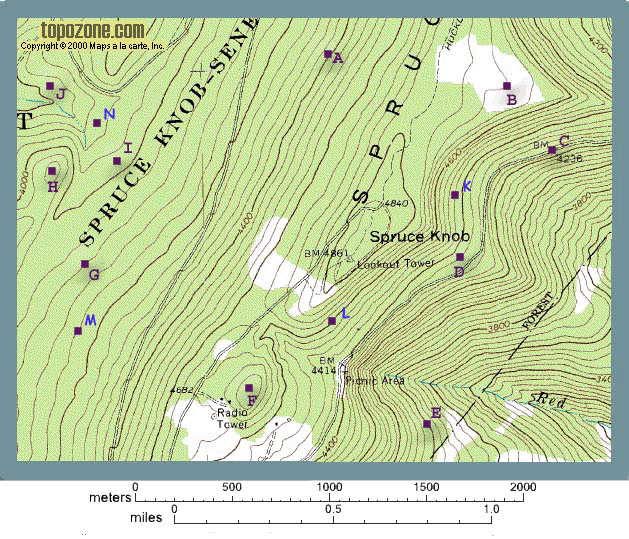
A. 4400 ft Point A sits right on a labeled index contour. Just follow along the contour line until you reach the label
B. 4720 ft Point B sits on a contour line, but it is not an index contour and its elevation is not labeled. First, lets look for a nearby index contour. There is one to the south and east of point B. This contour is labeled as 4600 ft. Next we need to determine if point B is above or below this index contour. Notice that if we keep going to the southeast we find contour lines of lower elevations (i.e. 3800 ft.). This means as we move away from 4600 ft. contour line toward point B, we are going up hill. So point B is above 4600 ft. Count the contour lines from 4600 ft to point B, there are three. Each contour line is 40 ft. (from our previous discussion of the contour interval) so point B is 120 ft. above 4600 ft, that is it is 4720 ft.
C. 4236 ft Point C sits right on a labeled bench mark so its elevation is already written on the map.
D. Point D is on an unlabeled contour line. From our discussion of point B above, you can see that point D is on the slope below Spruce Knob. Just above point D is an index contour. If we trace along this contour line we see its elevation. Since point D is the next contour line down hill from that elevation, its value will be one contour interval lower.
E. Like Point A above, Point E is on an index contour. Follow along this contour line until you come to the label.
F. Point F does not sit on a contour line so we can only estimate its elevation. The point is circled by several contour lines indicating it is a hill top. First, lets figure out the elevation of the contour line that circles point F. Starting from the nearest index contour line (4600 ft) we count up by 40 for the four contour lines. This gives us 4760 ft (4600ft + 40 ft, 4 times). Because point F is inside this contour line it must have an elevation above 4760 ft., but its elevation must be less than 4800 ft, otherwise there would be a 4800 contour line, which is not there. We don't really know the elevation, just that it is between 4760ft. and 4800ft.
G. In order to determine the elevation of point G we first must recognize it is on the western slope of Spruce Knob. Looking at the index contours we see that point G is somewhere between 4000 ft and 4400 ft contours. You do the rest.
H. Point H is circled by a contour line indicating it is the top of a small hill. Its elevation is determined the same way we determine the elevation of Point F. Keep in mind that you CANNOT determine the exact value, so for your answer give the appropriate range as in Point F.
I. ~3980 ft. Point I is also not on a contour line. It is also not on the top of a hill because a contour line does not encircle it. Instead it is in between to contour lines on the side of a hill. One of the contour lines is the 4000 ft index contour. The other contour is 3960 ft contour (40 ft lower, you can tell it is lower because you are moving toward the stream which is in the bottom of the valley). The elevation of point I is between 3960ft and 4000ft. Since point I is midway between these two contours we can estimate its elevation as midway between 3960 and 4000.
J. The elevation of point J is found the same way as the elevation of point I.