Contour Lines
Contour lines are lines drawn on a map
connecting points of equal elevation. If you walk along a contour line you
neither gain or lose elevation.
Picture walking along a beach exactly where the water meets the land (ignoring tides and waves for this example). The water surface marks an elevation we call sea level, or zero. As you walk along the shore your elevation will remain the same; you will be following a contour line. If you stray from the shoreline and start walking into the ocean, the elevation of the ground (in this case the seafloor) is below sea level. If you stray the other direction and walk up the beach your elevation will be above sea level (see diagram at right).
The contour line represented by the shoreline separates areas that have elevations above sea level from those that have elevations below sea level. We refer to contour lines in terms of their elevation above or below sea level. In this example the shoreline would be the zero contour line.
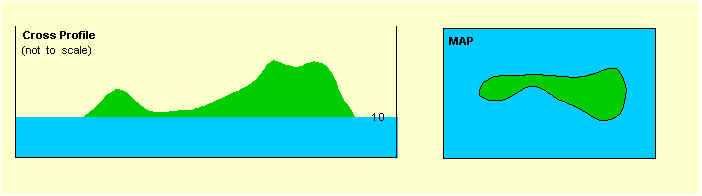
Contour lines are useful because they allow us to show the shape of the land surface (topography) on a map. The two diagrams below illustrate the same island. The diagram on the left is a view from the side (cross profile view) such as you would see from a ship offshore. The diagram at right is a view from above (map view) such as you would see from an airplane flying over the island.
The shape of the island is shown by the location of the shoreline on the map. Remember this shore line is a contour line. It separates areas that are above sea level from those that are below sea level. The shoreline itself is right at zero so we will call it the 0 ft. contour line.
The shape of the island is more complicated than the outline of the shoreline shown on the map above. From the profile it is clear that the islands topography varies (that is some parts are higher than others). This is not obvious on a map with just one contour line. But contour lines can have elevations other than sea level. We can picture this by pretending that we can change the depth of the ocean. The diagram below shows an island that is getting flooded as we raise the water level 10 ft above the original sea level.
The new island is obviously smaller than the original island. All of the land that was less than 10 ft. above the original sea level is now under water. Only land where the elevation was greater than 10 ft. above sea level remains out of the water. The new shoreline of the island is a contour line because all of the points along this line have the same elevation, but the elevation of this contour line is 10 ft above the elevation of the original shoreline. We repeat this processes in the two diagrams below. By raising water levels to 20 ft and 30 ft above the original see level we can find the location of the 20ft and 30 ft contour lines. Notice our islands gets smaller and smaller.
Fortunately we do not really have to flood the world to make contour lines. Unlike shorelines, contour lines are imaginary. They just exist on maps. If we take each of the shorelines from the maps above and draw them on the same map we will get a topographic map (see map below). Taken all together the contour lines supply us with much information on the topography of the island. From the map (and the profile) we can see that this island has two "high" points. The highest point is above 30 ft elevation (inside the 30 ft contour line). The second high point is above 20 ft in elevation, but does not reach 30 ft. These high points are at the ends of a ridge that runs the length of the island where elevations are above 10 ft. Lower elevations, between the 10 ft contour and sea level surround this ridge.
With practice we can picture topography by looking at the map even without the cross profile. That is the power of topographic maps.
|
|
Back to previous page | Back to home page |
Next page |
|